$treet $mart$: How Much Is My Business Worth?

$treet $mart$ (vol. 22)
Finance & Economics Focus
Launching or buying a business is an exciting adventure, but the potential for success lies in understanding essential elements such as valuations and revenue models. Having this knowledge won't just benefit us when selling or leveraging our venture - it's also indicative of our ability to create sturdy income streams. Without comprehending these fundamentals, we may find ourselves ill-prepared and our businesses at risk.
Simply put, every hour invested in our business should be yielding a future ROI. Therefore, it is critical that we strategically think about the revenue streams in our business. And be aware that the revenue model and profit margins in our business will be the guideposts future financiers will use to value our business when seeking funding, exploring a sale, or creating leverage for ourselves.
financier
[fi-nən-ˈsir]
1: one who specializes in raising and expending public moneys
2: one who deals with finance and investment on a large scale.
Revenue models and their equity multiples are crucial factors in understanding your business's current and future value. However, not all models are created equal; transactional ones generally don't fare as well as those with recurring revenues when it comes to achieving higher equity multiples. From subscription-based models to purchasing in bulk, we can choose which pricing mechanisms. And if we are smart, we can change the way our revenue models work in order to create more intrinsic value in the future.
The 4 Revenue Models
- Transaction-based revenue: Revenue from sales of goods or services that usually result in one-time customer payments. Think retail shopping, real estate brokerage, and restaurants.
- Service revenue: Revenues generated by providing service to customers are calculated based on time. For example, the number of hours of consulting services provided. Think Consulting, Marketing Agencies, Retainers, and Traditional Personal Training.
- Project revenue: Revenues earned through one-time projects with existing or new customers. Think Contracting, graphic design, websites design & development.
- Recurring revenue: Earnings from ongoing payments for continuing services or after-sale services to customers. The recurring revenue model is the model most commonly used by businesses because it is predictable and it assures the company’s source of revenue is ongoing. Think Software as a service (SaaS), Marketing, Gym memberships, online coaching platforms, email newsletters, trash/waste management.
REVENUE MULTIPLE
Experienced entrepreneurs understand that the success of businesses hinges on more than just a great idea and proven leaders - as do investors and financiers. As a result, revenue multiples by industry have become a popular way to value businesses across various sectors. This is also a great tool to measure up comparable companies.
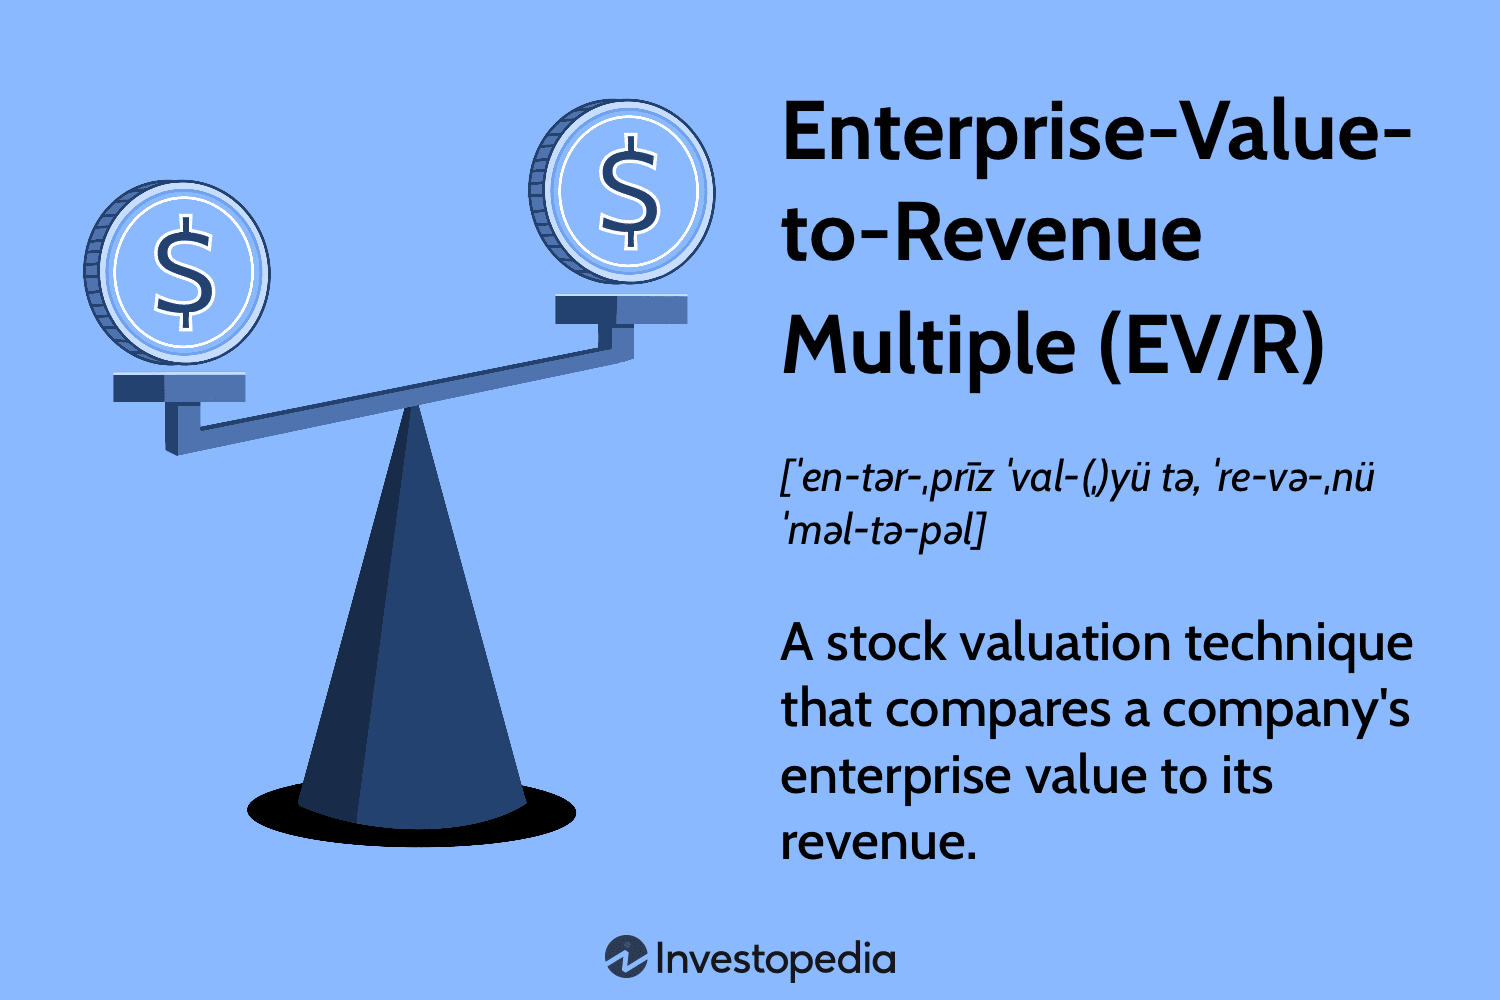
WHAT IS A REVENUE MULTIPLE?
Revenue multiples can give investors and financial analysts a bird's eye view of the profitability potential of businesses, especially those in their early stages. These ratios are built upon gross revenues to create an industry-specific 'factor' that reveals whether any given business stands out from similar public companies. With wider data sets underpinning such metrics, revenue multiples become much more reliable indicators for future success.

Smart Companies Stack Streams
Instead of focusing solely on transactional or project-based revenue, we have an opportunity to make our businesses more valuable in the long run by pursuing multiple revenue models - and if possible a recurring revenue model. Businesses like roofing, painting, and software development can deliver high-ticket contracts but they would be challenging to convert into recurring revenue.
The Highest Multiples
Software as a service (SaaS), is far and away the most scalable way to high valuation multiples. It's unique in its ability to duplicate without the need for more people power. Therefore it has an infinite scale and lots of recurring subscriptions
Whether you're looking to compare with similar companies or just trying to get started on figuring out how much something is worth, knowing these industry benchmarks may give you some useful insight.
- 1x – This business is dealing with products that don't promise much margin or growth – a tough road ahead!
- Less than 3x – Investors interested in a reliable source of income might benefit from putting their money into businesses with an established and consistent cash flow. Many such companies are available, offering investors the chance to profit through consistent revenue streams over time.
- 3x to 5x – Investors are cautiously optimistic about businesses in this particular sector, viewing them as dependably decent chances for success.
- More than 10x – This category is the ‘A-list’ as per investors. Businesses displaying a 10x or more valuation have the highest chances of growth, profits, and expansion. Think SaaS
How Does My Business Stack Up?
Here is a comprehensive list of Revenue Multiples by industry from eqvista.com.
| Row Labels | Annual Volatility | EV to Revenue |
|---|---|---|
| Accident & Health Insurance | 44.03% | 0.98 |
| Advertising | 71.76% | 9.96 |
| Aerospace | 37.30% | 3.06 |
| Agricultural Chemicals | 62.18% | 2.88 |
| Air Freight/Delivery Services | 43.54% | 2.79 |
| Aluminum | 42.03% | 1.57 |
| Apparel | 29.00% | 1.77 |
| Assisted Living Services | 53.87% | 4.41 |
| Auto Manufacturing | 96.23% | 12.53 |
| Auto Parts: O.E.M. | 41.07% | 1.76 |
| Automotive Aftermarket | 63.62% | 1.57 |
| Banks | 40.35% | 3.46 |
| Beverages (Production/Distribution) | 62.32% | 7.85 |
| Biotechnology: Biological Products (No Diagnostic Substances) | 111.05% | 17.75 |
| Biotechnology: Commercial Physical & Biological Research | 110.13% | 10.33 |
| Biotechnology: Electromedical & Electrotherapeutic Apparatus | 62.78% | 16.85 |
| Biotechnology: In Vitro & In Vivo Diagnostic Substances | 110.61% | 6.68 |
| Biotechnology: Laboratory Analytical Instruments | 89.65% | 5.03 |
| Broadcasting | 33.77% | 3.49 |
| Building Materials | 68.86% | 2.84 |
| Building operators | 51.84% | 6.25 |
| Building Products | 76.38% | 2.78 |
| Business Services | 91.84% | 14.37 |
| Catalog/Specialty Distribution | 92.93% | 2.54 |
| Clothing/Shoe/Accessory Stores | 74.62% | 1.35 |
| Coal Mining | 64.42% | 1.54 |
| Commercial Banks | 38.70% | 3.24 |
| Computer Manufacturing | 65.60% | 2.20 |
| Computer peripheral equipment | 83.97% | 3.23 |
| Computer Software: Prepackaged Software | 112.17% | 17.81 |
| Computer Software: Programming Data Processing | 0.00% | 2.68 |
| Construction/Ag Equipment/Trucks | 41.67% | 19.54 |
| Consumer Electronics/Appliances | 91.75% | 1.95 |
| Consumer Electronics/Video Chains | 155.48% | 2.24 |
| Consumer Specialties | 92.25% | 1.04 |
| Containers/Packaging | 73.17% | 2.09 |
| Department/Specialty Retail Stores | 83.54% | 1.49 |
| Diversified Commercial Services | 50.40% | 6.08 |
| Diversified Financial Services | 72.81% | 5.15 |
| Diversified Manufacture | 78.36% | 4.01 |
| EDP Services | 104.67% | 23.45 |
| Electric Utilities: Central | 47.28% | 5.72 |
| Electrical Products | 76.09% | 6.01 |
| Electronic Components | 62.49% | 2.23 |
| Electronics Distribution | 10.20% | 2.07 |
| Engineering & Construction | 69.18% | 1.09 |
| Environmental Services | 69.21% | 7.16 |
| Farming/Seeds/Milling | 51.92% | 2.60 |
| Finance Companies | 40.90% | 0.91 |
| Finance/Investors Services | 26.05% | 3.94 |
| Finance: Consumer Services | 56.96% | 14.29 |
| Fluid Controls | 63.58% | 3.46 |
| Food Chains | 50.46% | 0.31 |
| Food Distributors | 52.08% | 1.47 |
| Forest Products | 85.21% | 0.51 |
| Home Furnishings | 75.83% | 1.93 |
| Homebuilding | 94.44% | 2.80 |
| Hospital/Nursing Management | 93.04% | 1.71 |
| Hotels/Resorts | 57.54% | 8.29 |
| Industrial Machinery/Components | 95.75% | 6.81 |
| Industrial Specialties | 74.91% | 6.54 |
| Integrated oil Companies | 61.53% | 1.73 |
| Internet and Information Services | 59.87% | 5.19 |
| Investment Bankers/Brokers/Service | 58.67% | 8.57 |
| Investment Managers | 76.15% | 6.62 |
| Life Insurance | 35.40% | 2.91 |
| Major Banks | 51.71% | 3.04 |
| Major Chemicals | 56.96% | 3.12 |
| Major Pharmaceuticals | 59.83% | 7.75 |
| Managed Health Care | 47.05% | 14.97 |
| Marine Transportation | 60.64% | 2.12 |
| Meat/Poultry/Fish | 54.55% | 1.93 |
| Medical Electronics | 53.99% | 3.86 |
| Medical Specialties | 81.53% | 4.89 |
| Medical/Dental Instruments | 90.51% | 10.17 |
| Medical/Nursing Services | 74.13% | 3.11 |
| Metal Fabrications | 90.06% | 3.98 |
| Military/Government/Technical | 78.51% | 4.43 |
| Misc Health and Biotechnology Services | 0.00% | 6.78 |
| Motor Vehicles | 116.73% | 4.65 |
| Movies/Entertainment | 51.01% | 6.51 |
| Multi-Sector Companies | 59.62% | 10.34 |
| Natural Gas Distribution | 50.47% | 3.55 |
| Newspapers/Magazines | 56.92% | 2.00 |
| Office Equipment/Supplies/Services | 66.02% | 3.66 |
| Oil & Gas Production | 62.40% | 8.51 |
| Oil Refining/Marketing | 55.74% | 0.93 |
| Oil/Gas Transmission | 31.62% | 4.62 |
| Oilfield Services/Equipment | 67.36% | 3.29 |
| Ophthalmic Goods | 95.78% | 14.57 |
| Ordnance And Accessories | 77.24% | 3.82 |
| Other Consumer Services | 42.07% | 7.38 |
| Other Metals and Minerals | 89.21% | 2.56 |
| Other Pharmaceuticals | 50.76% | 0.92 |
| Other Specialty Stores | 127.77% | 2.30 |
| Other Transportation | 0.00% | 6.15 |
| Package Goods/Cosmetics | 70.48% | 4.22 |
| Packaged Foods | 42.61% | 2.17 |
| Paints/Coatings | 50.13% | 2.85 |
| Paper | 41.24% | 1.40 |
| Plastic Products | 41.00% | 1.31 |
| Pollution Control Equipment | 54.28% | 1.65 |
| Power Generation | 53.62% | 4.74 |
| Precious Metals | 53.43% | 2.50 |
| Precision Instruments | 50.53% | 5.01 |
| Professional Services | 57.43% | 2.18 |
| Property or Casualty Insurers | 46.69% | 1.01 |
| Publishing | 49.14% | 31.54 |
| Radio And Television Broadcasting And Communications Equipment | 123.14% | 5.59 |
| Railroads | 68.00% | 5.08 |
| Real Estate Investment Trusts | 75.58% | 17.62 |
| Real Estate | 94.77% | 12.69 |
| Recreational Products/Toys | 55.84% | 2.54 |
| Rental/Leasing Companies | 87.89% | 5.31 |
| Restaurants | 94.04% | 6.62 |
| RETAIL: Building Materials | 66.18% | 1.15 |
| Retail: Computer Software & Peripheral Equipment | 73.85% | 17.18 |
| Savings Institutions | 47.66% | 5.35 |
| Semiconductors | 102.78% | 9.82 |
| Service to the Health Industry | 78.43% | 2.00 |
| Services or Misc. Amusement & Recreation | 29.34% | 5.50 |
| Shoe Manufacturing | 97.13% | 2.50 |
| Specialty Chemicals | 12.36% | 7.31 |
| Specialty Foods | 47.76% | 4.52 |
| Specialty Insurers | 66.80% | 3.01 |
| Steel/Iron Ore | 60.14% | 2.19 |
| Telecommunications Equipment | 59.15% | 6.19 |
| Television Services | 97.80% | 5.95 |
| Textiles | 59.09% | 1.50 |
| Tobacco | 30.39% | 0.92 |
| Tools/Hardware | 95.34% | 3.35 |
| Transportation Services | 47.51% | 0.99 |
| Trucking Freight/Courier Services | 68.96% | 2.00 |
| Trusts Except Educational Religious and Charitable | 21.76% | 0.79 |
| Water Supply | 71.57% | 5.22 |
| Wholesale Distributors | 84.71% | 3.75 |
Key Takeaways
- Launching a business requires understanding essential elements such as valuations and revenue models to ensure future success.
- Revenue can be generated in various ways, from subscription-based models to purchasing in bulk.
- Transactional models usually don't fare as well as those with recurring revenues when it comes to achieving higher equity multiples.
- Revenue multiples are used when determining the value of a business and provide baseline results.
- Businesses displaying a 10x or more valuation indicated the highest chances of growth, profits, and expansion - especially SaaS companies.
- The value of your business is closely linked with your margins and revenue model.
finance
[ fi-nans, fahy-nans ]
the management of revenues; the conduct or transaction of money matters generally. In our business, the finance function is about ensuring the sustainability of the business by way of managing Revenue, Expenses, Profit, Assets, Liabilities, Capital, Taxes
Best,
Samson
🎙️ Mini-Clips from PAIN TO PROFIT$


➡️Subscribe to our podcast Apple Podcast | Spotify | YouTube
Need More Info?
- Need help with another topic of business? Start Here
- Want more Finance info?
- Check out the MBA Reading List for our MUST-READ books for new Entrepreneurs.

➡️Follow us: Instagram | TikTok | LinkedIn | YouTube
How did you like today's email?
Let us know what you think so we can continue to improve:

